
ADS-B Radio Planespotting
With some cheap parts and a free afternoon, I created an aircraft tracking station at home

With some cheap parts, a free afternoon, and a bit of knowledge, I created an aircraft tracking station at home. The first step in this project is gaining a basic understanding in how everything works and what we are trying to accomplish. ADS-B is an aircraft transponder protocol that allows ground based stations and in cockpit equipment to collect information about other planes nearby. ADS-B typically operates at 1090MHz and provides data on the aircraft's position, speed, type, and call-sign. If you have ever used a flight tracking site such as FlightRadar24 (who will make a few more appearances later) you have benefited from community captured ADS-B. data
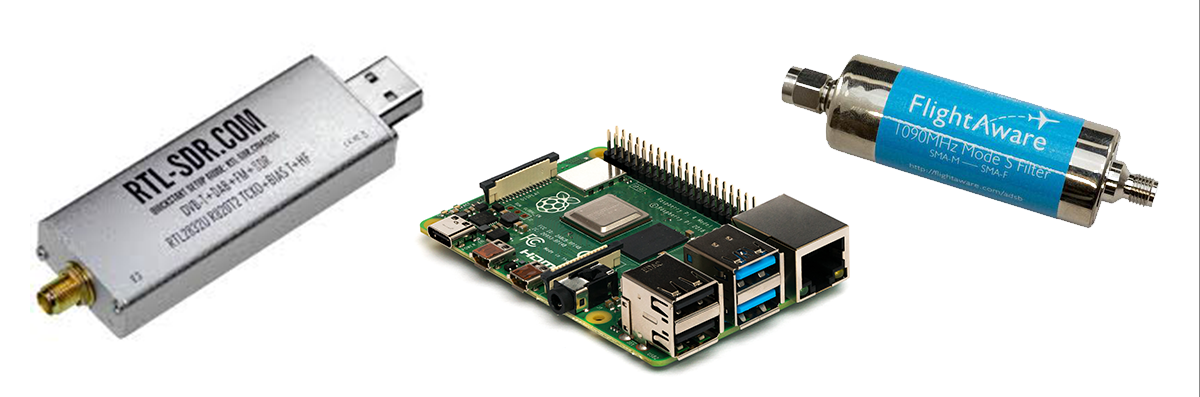
Here's what I used to get everything running:
- Raspberry Pi 3+
- RTL-SDR Dongle
- A homemade antenna (more on that later)
- FlightAware ADS-B Filter
Part 1: Indoor Hardware
The first step I took was to procure the hardware needed and begin testing. Getting things up and running is fairly simple. Plug the SDR (software defined radio) dongle into the Raspberry Pi via USB and power things up. The OS on the Raspberry Pi is the FlightRadar24's "Pi24" client. Once started, Pi24 will ask for some basic info about the location of the tracking station and after assigning you an ID will begin tracking. Pi24 will begin outputting its data to the web based GUI, Dump1090. By navigating to the page given by Pi24 from a browser on your network, you will be able to see a map with any planes you are tracking displayed.
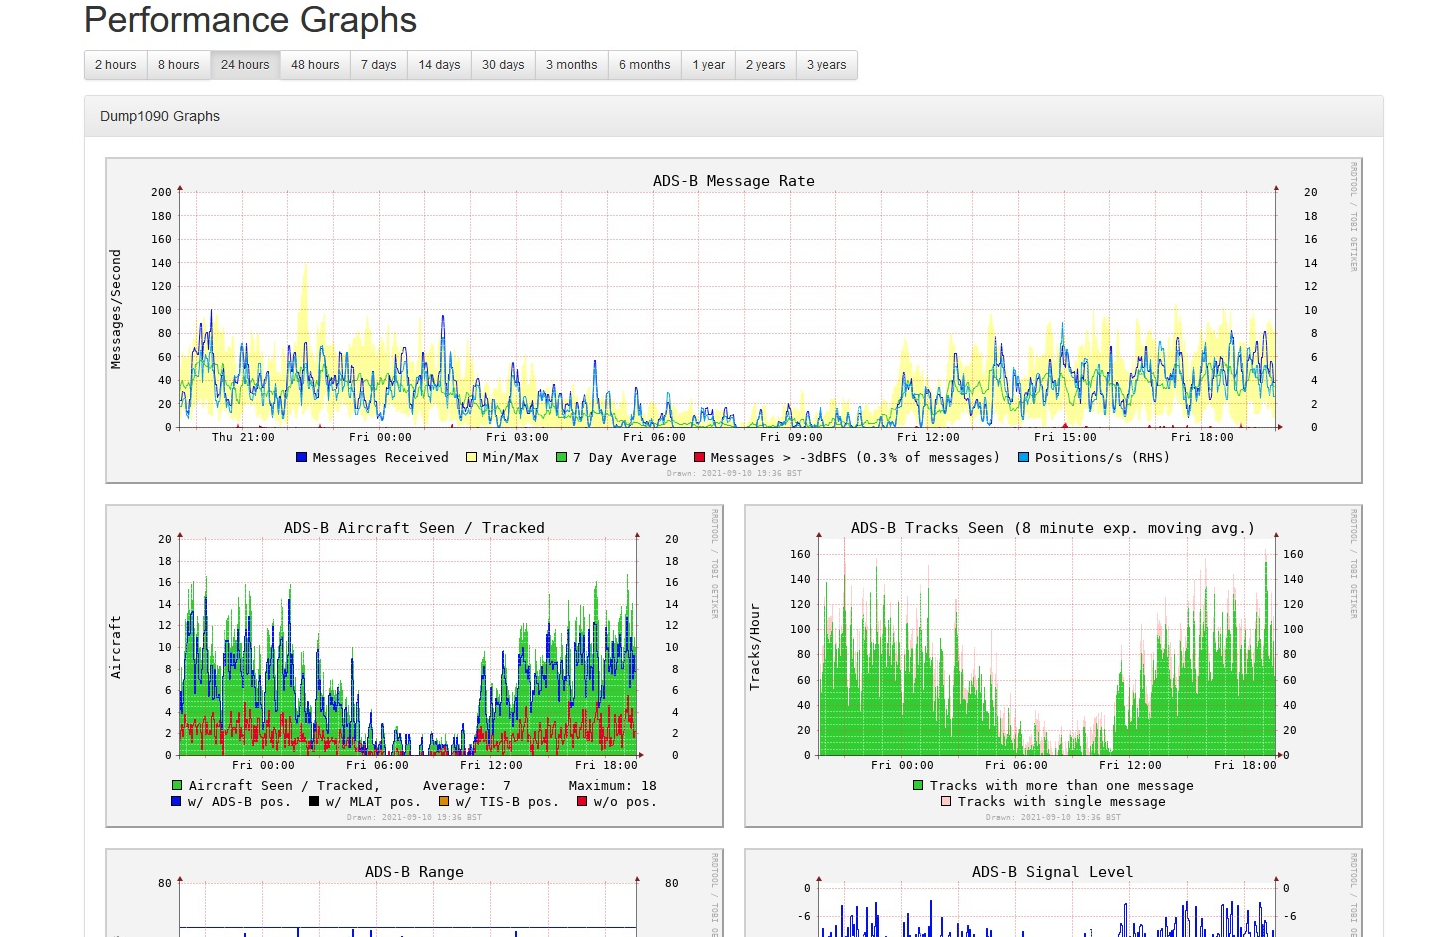
Part 2: Additional Software Options
In addition to the main Dump1090 mapping service, additional packages can be installed that can be used to graph the ADS-B. One of the most popular tools for this is a companion to the Dump1090 interface called Graphs1090. Once installed, Graphs1090 pulls additional data from the SDR to provide graphs and long term recording of the ADS-B data being received by the station. The plots and historical data provided by Graphs1090 allow for more insights to be made into the performance of the tracking station and patterns in the air traffic in your area.
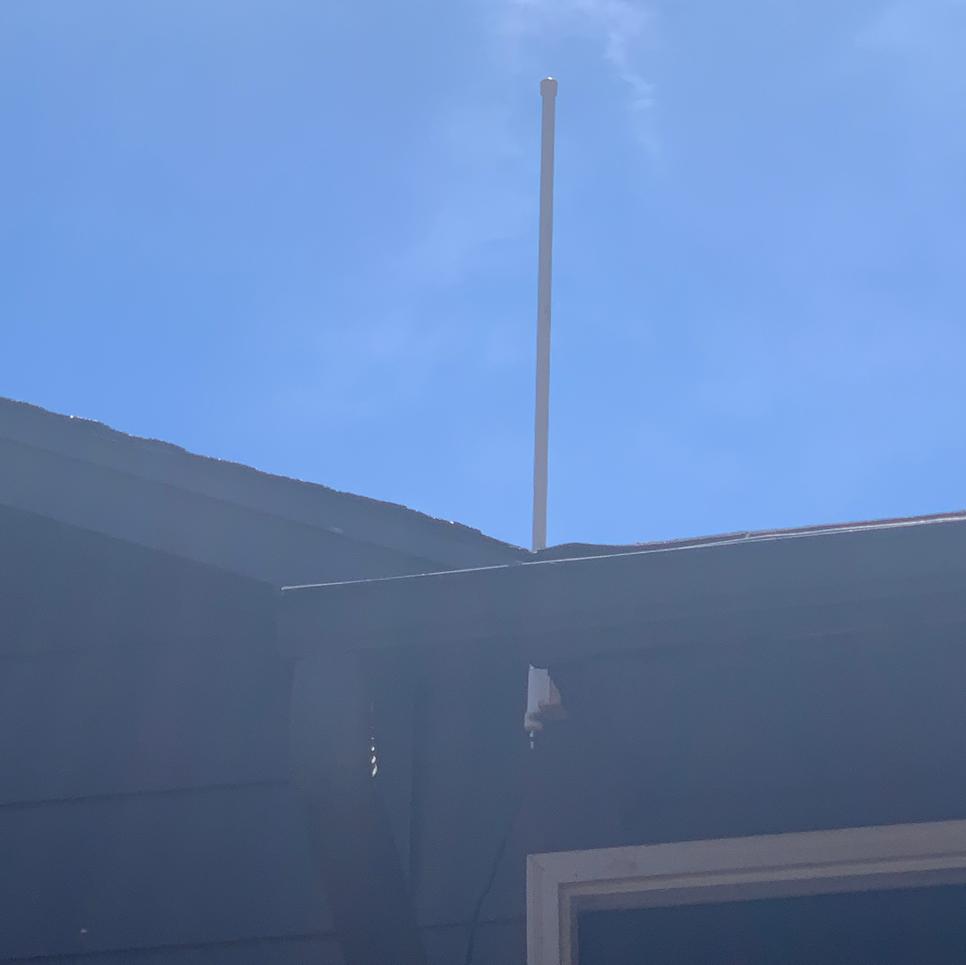
Part 3: Outdoor Hardware
Of course, the little antenna I had inside my bedroom for testing was not very useful in tracking aircraft, especially considering that ADS-B for the most part requires a direct line of sight. After some research (and quickly deciding that a commercially available option would be much too expensive) I chose to construct my own antenna. Following a helpful guide from balarad.net, I began turning some old coaxial cable and a piece of PVC pipe into fairly effective ADS-B antenna. By mounting on high up point, my range was greatly increased and I began tracking a fair number of planes for my area.
Part 4: Benefits
In addition to being a fun project, collecting ADS-B data has its benefits. By sharing the data with FlightRadar24 to increase their coverage area (which happens automatically when using Pi24) you can get a free FlightRadar24 Business level subscription, which unlocks the advanced, premium features of FlightRadar24.
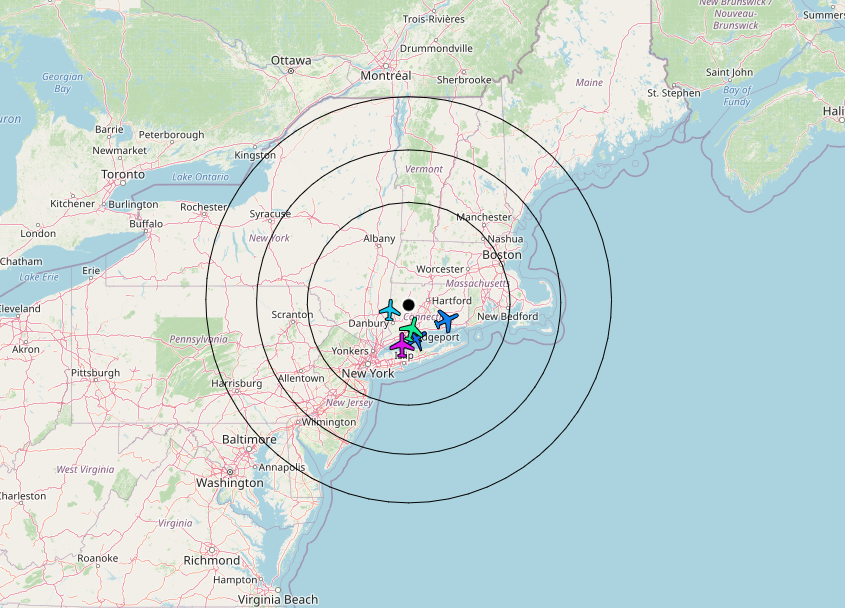
Update (2/19/2022)
After some time collecting data, I decided to pull a range of data into MATLAB in order to do some analysis. Below is the result of about 5 months of data being animated day by day as well as a combined plot at the end of the animation. The first contact and final contact positions are plotted for each aircraft. The color of each point is determined by the altitude of the aircraft.